Paper 6 – How do plyometrics improve stretch-shortening cycle function? S&C Research August 2021
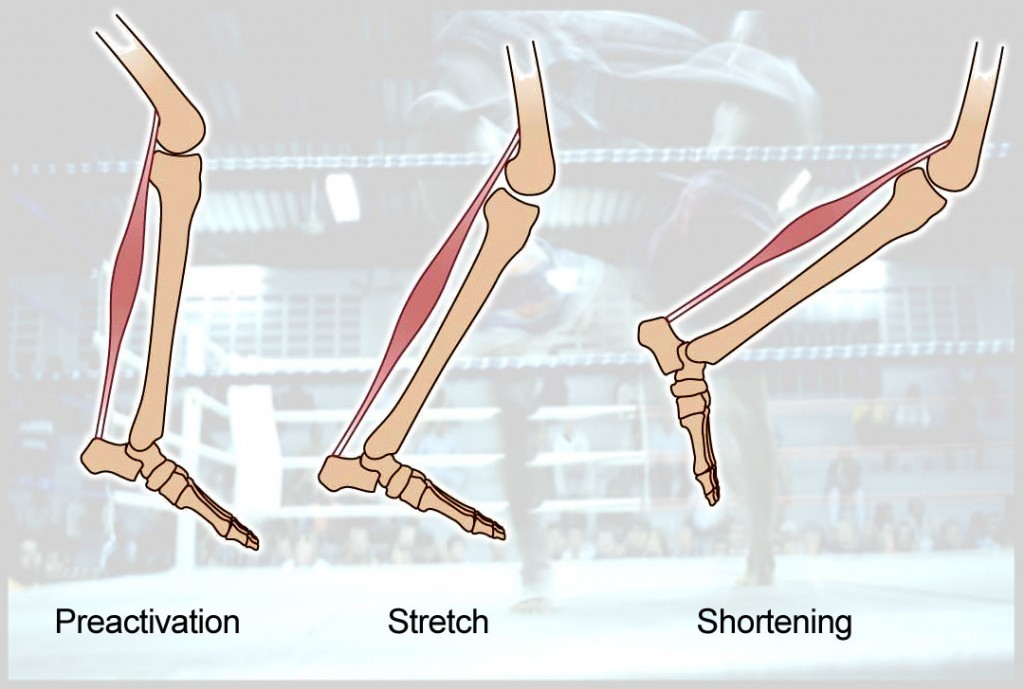
We all are aware of the physiological function of plyometrics, to increase our stretch shorten cycle (SSC) which has benefits in many sporting activities such as sprinting and speed performance. What is often less well understood is what exactly is taking place physiologically when we have our athletes undertake these training regimes.
Firstly, plyometric training has a greater effect upon muscle strength than it does tendon strength/stiffness. In fact plyometrics have been shown to increase eccentric and isometric muscle strength resulting in less “give” when performing a plyometric activity which results in the tendon having to stretch more and provide additional elastic energy throughout the jump activity.
Also by lengthening less in the eccentric phase, muscles necessarily shorten less in the following concentric phase. By shortening less, they shorten less quickly for the same joint angular velocity, and this allows them to produce higher forces owing to the force-velocity relationship.
Also heavy strength training specifically targets tendon stiffness which can reduce the SSC of muscultendon complex – so as with many of these physical and training attributes, it is a combination of training modalities that potentially can lead to the best outcome.
Performing heavy strength training in conjunction with plyometric training should lead to the best outcome – that being a stiffer tendon (allowing for more potential for elastic stretch – like stretching a larger rubber band) and strong muscles eccentrically ensuring that the increase in muscle stiffness can be utilised during any jumping/sprinting performance.
Paper 7 – Kinematics of Sprinting in Children and Youths by Marian Vanderka and Tomáš Kampmiller. New Studies in Athletics · no. 1./2.2013

Running velocity and stride length were found to be highly dependent on age. Based on their findings, the authors recommend that children and youths be evaluated on the basis of stride frequency and support phase duration. Those with results two or three standard deviations higher than the population averages should be considered as talented and directed to an appropriate programme of training and development.
Interestingly, most elite sprint research shows that cadence isn’t the defining difference between elite sprinters but is a major factor in sub-elite/youth sprinters. Interestingly from this study they allude to the importance of a highly responsive neural system with a focus on short support phase duration (ground contact time). Elite track coaches like Dan Pfaff suggests that the ability to produce high forces in short ground contact times (as is required by elite sprinters) is largely genetic and this study reinforces that viewpoint.
So early on, talent ID should be focused on the above attributes (cadence and GCT) and then training and strength will allow the athlete to develop the stride length and corresponding running velocity to excel in the sprint events.
Paper 8 – Selected Determinants of Acceleration in the 100m Sprint. doi: 10.1515/hukin-2015-0014

The goal of this study was to examine the relationship between kinematics, motor abilities, anthropometric characteristics, and the initial (10 m) and secondary (30 m) acceleration phases of the 100 m sprint among athletes of different sprinting performances. Eleven competitive male sprinters (10.96 s ± 0.36 for 100 with 10.50 s fastest time) and 11 active students (12.20 s ± 0.39 for 100 m with 11.80 s fastest time) volunteered to participate in this study.
The most important factor for differences in maximum speed development during both the initial and secondary acceleration phase among the two sub-groups was the stride frequency.
Again this study reinforces the importance of stride frequency/cadence in the sub-elite sprint population.
Paper 9 – A Kinematics Analysis Of Three Best 100 M Performances Ever. doi: 10.2478/hukin-2013-0015
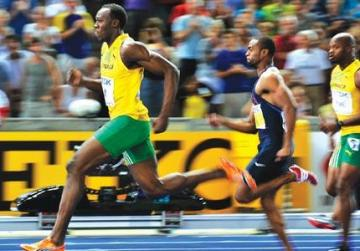
The main hypothesis was that the step length is the main factor that determines running speed throughout the entire 100 m distance. Usain Bolt’s best 3 100m performances (9.58, 9.63 9.69) were analysed.
Bolt showed an average of 20 cm longer stride than his competitors. His ability to generate high ground reaction forces (due to his size and limb lengths) results in high top end velocities (12.05 – 12.34 m/s) in some 10 m sections of his three 100 m performances.
In most 10 m sections of the 100 m sprint, the step length was the parameter that significantly determined the increase of maximal running speed, therefore, distinguishing Bolt from the other finalists.
This study alludes to the fact that sub-elite sprinters rely heavily upon stride rate/cadence for their performances whereas at the elite end of the sprint curve, stride length is the defining factor.
Paper 10 – Sprint start kinematics during competition in elite and world-class male and female sprinters. http://dx.doi.org/10.1080/02640414.2016.1221519
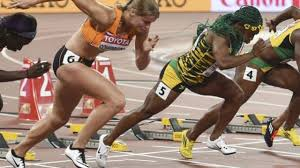
This study aimed to determine whether kinematic differences between the sexes are attributable to an effect of sex per se, or rather to the absolute performance level of the sprinters, quantified by the 100-m time. A total of 20 sprinters (10 M, 10 F), including world-class and elite athletes, were assessed. Start phases from the “set” position to the first two steps were analysed.
Linear regression analyses showed a few significant differences between sexes when taking into account the effect of performance level: Males had shorter pushing phase duration, higher horizontal velocity at block clearing, and shorter contact times of the first two steps. Conversely, the performance level affected most of the examined parameters: faster sprinters showed the centre of mass (CM) closer to the ground and a more flexed front knee in the “set” position, longer pushing phase duration, lower vertical velocity of the CM at block clearing, and shorter contact times and longer flight times in the first two steps.
These findings suggest that the main differences between male and female sprint athletes are performance level differences (guided by physical attributes – strength, power) rather than affected by the sex of the sprinters.
From a coaching perspective, this tells you that the stronger and more powerful you can develop your female athletes, the closer to male performance levels that can be achieved.
If you like this content, please check out my previous Review of the Literature blog here: https://fatchfitness.com/review-of-the-literature-september-2021/
For some great insight into the kinematics and kinetics of sprinting – you can’t go past Ken Clarke and his excellent research into the two mass spring model of sprinting amongst other research thoughts (Ken Clarke Resources).